
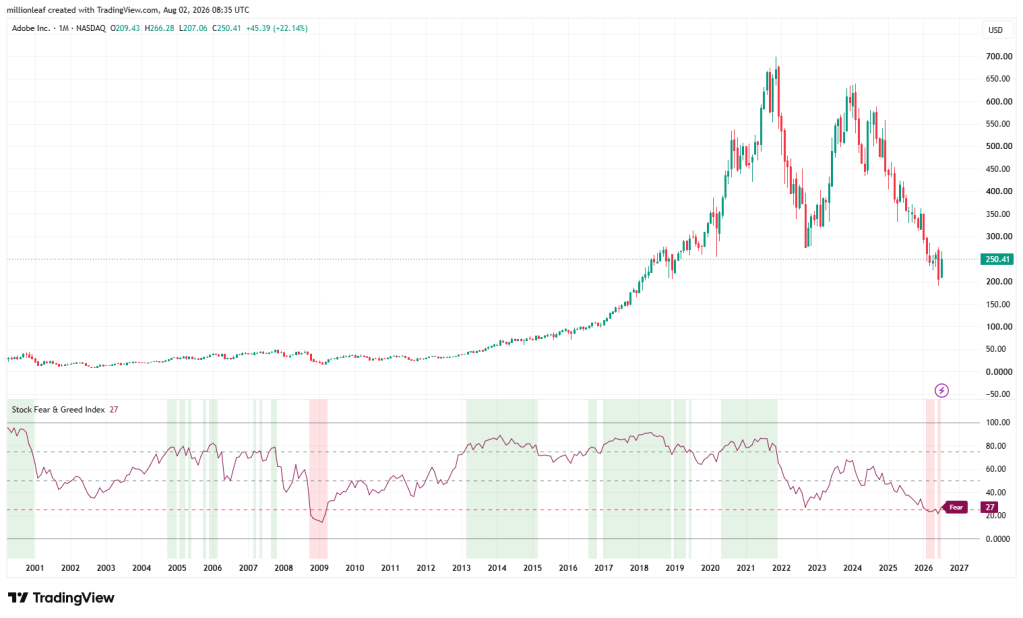
The Stock Fear & Greed Index measures the overall market sentiment surrounding an individual stock by combining multiple price, momentum, volatility, and trading-related indicators into a single score ranging from 0 to 100.
The index is divided into four sentiment zones:
- Extreme Fear (0–25) – Red
- Fear (26–50) – Orange
- Greed (51–75) – Light Green
- Extreme Greed (76–100) – Green
When the index enters the Extreme Fear zone, the chart background turns red, highlighting periods of excessive pessimism. When it reaches the Extreme Greed zone, the background turns green, indicating excessive optimism.
The blue line represents the Stock Fear & Greed Index for the selected stock over time, allowing investors to monitor how market sentiment evolves.
The index is designed to complement fundamental analysis rather than replace it. High levels of fear may indicate periods when quality companies deserve closer attention, while extreme greed may signal that expectations have become overly optimistic. It should always be used together with business quality, intrinsic value, and margin of safety analysis when making investment decisions.
 Million Leaf