The Intrinsic Value Calculator is a proprietary analytical script developed for the TradingView charting platform. It applies structured valuation methodologies to estimate a company’s intrinsic value directly on the price chart, enabling users to assess valuation efficiently and consistently across securities.
The tool is designed to support disciplined, fundamentals-driven investment decisions, minimizing reliance on short-term market sentiment while emphasizing cash-flow generation, profitability, and capital strength.
Intrinsic Value: Conceptual Framework
Intrinsic value represents the fundamental economic worth of a company, derived from its ability to generate sustainable cash flows over time. Unlike market prices—which may fluctuate due to sentiment, liquidity, or macro factors—intrinsic value focuses on long-term business fundamentals.
From a professional investment perspective, intrinsic value serves as a benchmark for:
- Identifying mispriced securities
- Assessing downside protection
- Enforcing valuation discipline
- Establishing a margin of safety
Intrinsic value estimation typically incorporates:
- Cash-flow based valuation
- Earnings sustainability
- Capital structure and balance-sheet strength
- Return on capital and financial resilience
Valuation Methodology
The Intrinsic Value Calculator employs two complementary valuation models, balancing forward-looking expectations with current earnings strength. The final intrinsic value estimate is derived from the average of both models, reducing model-specific bias.
1. Discounted Cash Flow (DCF) Model
The DCF model estimates intrinsic value based on the present value of a company’s expected future cash flows.
Key characteristics:
- Values the business based on its cash-generating capacity
- Explicitly accounts for the time value of money
- Anchors valuation to long-term fundamentals rather than market price
Discount Rate Assumption:
A conservative risk-free rate proxy (e.g. fixed deposit or government bond yield) is used to discount future cash flows, emphasizing capital preservation and valuation prudence.
2. Earnings Power Model
The Earnings Power model evaluates intrinsic value by comparing a company’s current earnings capacity against low-risk alternative investments.
Key characteristics:
- Focuses on normalized, current profitability
- Minimizes reliance on aggressive growth assumptions
- Useful for assessing valuation under conservative scenarios
This approach helps determine whether a company’s earnings justify equity risk when compared to risk-free or low-risk instruments.
Blended Valuation Approach
By averaging outputs from:
- A forward-looking cash flow model, and
- A current earnings-based model,
the framework produces a more balanced and robust intrinsic value estimate that incorporates both growth potential and earnings durability.
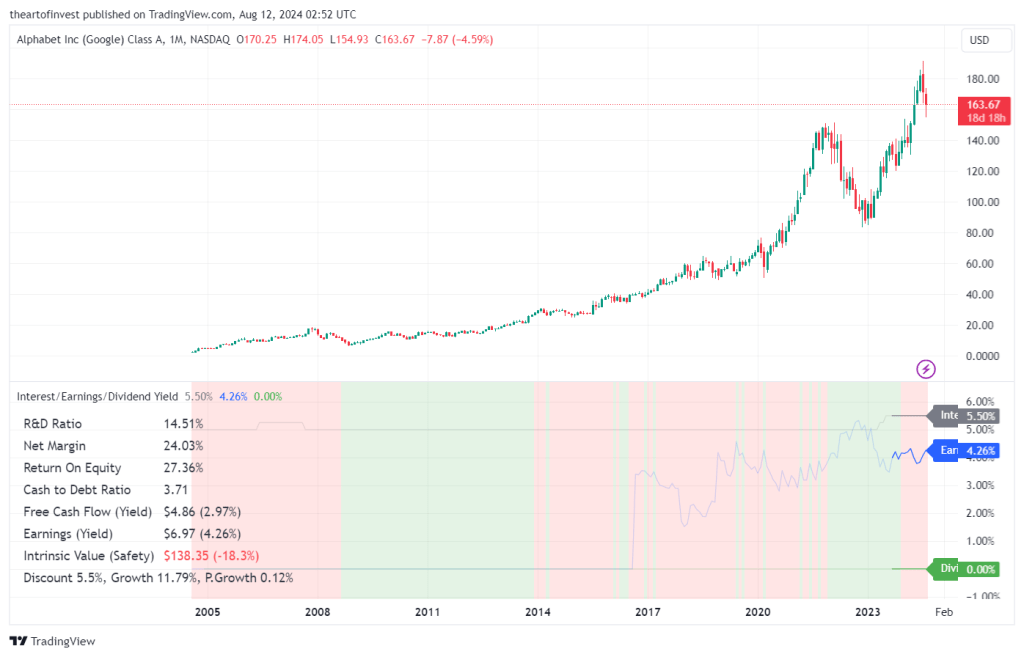
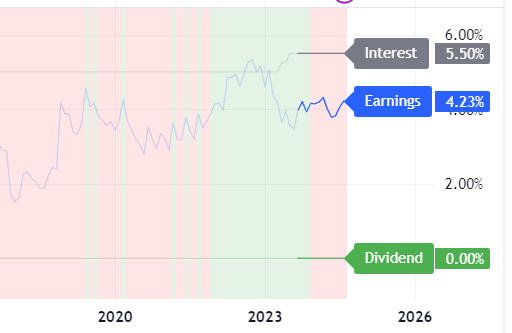
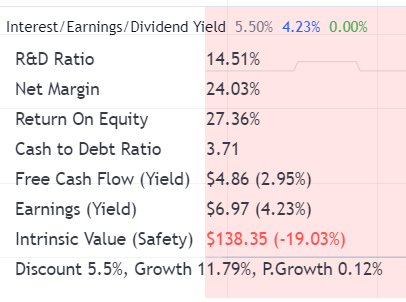
Comparative Yield Analysis
Line Chart: Earnings Yield vs Dividend Yield vs Risk-Free Rate
In addition to intrinsic value estimation, the script plots:
- Earnings Yield
- Dividend Yield
- Current Fixed Deposit (Risk-Free) Rate
This visualization enables direct comparison between equity returns and low-risk alternatives, supporting relative allocation decisions.
Interpretation framework:
- If earnings yield and/or dividend yield materially exceed the risk-free rate, the stock may offer adequate compensation for equity risk.
- If yields fall below the risk-free rate, capital allocation to lower-risk instruments may be more appropriate.
Key Yield Metrics
Earnings Yield (Profitability Measure)
Earnings yield measures profitability relative to price and is calculated as:
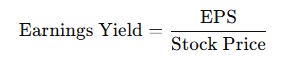
Interpretation:
- Higher earnings yield indicates stronger profit generation per unit of capital invested.
- Useful for comparing equities against bonds, fixed deposits, and other yield-based instruments.
Dividend Yield (Income Component)
Dividend yield measures cash income returned to shareholders relative to price.

Interpretation:
- Relevant for income-focused strategies
- Assesses whether dividend income compensates for equity risk versus fixed-income alternatives
Fixed Deposit Rate (Risk-Free Benchmark)
The fixed deposit rate serves as a baseline return benchmark, representing the expected return from capital-preserving investments with minimal credit risk.
All equity returns should be evaluated relative to this benchmark to ensure adequate risk compensation.
Financial Quality Indicators
Beyond valuation, the Intrinsic Value Calculator integrates financial strength and efficiency metrics to assess business quality and resilience.
R&D Ratio
The R&D Ratio is a metric used to compare the efficiency of research and development (R&D) spending among companies within the same industry. It is calculated by dividing R&D expenses by total revenue:
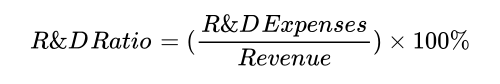
- This ratio reflects a company’s investment in innovation, technology, and product development.
- It helps investors compare R&D efficiency across different companies within an industry.
Net Profit Margin (Net Margin)
Net profit margin, or net margin, measures a company’s overall profitability by indicating the percentage of revenue that remains after deducting all operating expenses, interest, taxes, and other costs.
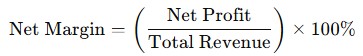
- A consistently high net margin suggests that a company operates efficiently, maintains effective cost control, and possesses strong pricing power. From a fundamental analysis perspective, businesses with stable and elevated net margins often exhibit durable competitive positioning, allowing them to sustain profitability across different economic conditions.
- Net margin consistency over time is particularly important, as it reflects the resilience of a company’s business model and its ability to protect earnings despite industry competition or macroeconomic pressures.
Return on Equity (ROE)
ROE measures how effectively a company generates returns on shareholder capital.
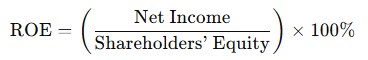
Assessment focus:
- Consistency and sustainability of ROE
- Avoidance of ROE driven primarily by excessive leverage
- Preference for businesses with durable profitability and disciplined capital allocation
Cash-to-Debt Ratio
The Cash-to-Debt Ratio evaluates a company’s ability to meet debt obligations using internally generated cash.
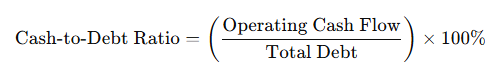
Why this matters:
- Indicates balance-sheet resilience
- Reduces refinancing and solvency risk
- Enhances flexibility during economic downturns
- Supports long-term operational continuity
Companies with strong cash-to-debt positions are structurally better positioned to withstand adverse market conditions without reliance on external financing.
Free Cash Flow Yield
Free Cash Flow (FCF) Yield measures how efficiently a company converts revenue into distributable cash after capital expenditures.
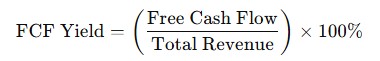
Interpretation:
- Higher FCF yield indicates stronger internal funding capacity
- Supports dividends, debt reduction, reinvestment, or capital returns
- Signals operational efficiency and earnings quality
Businesses requiring minimal ongoing capital expenditure to sustain operations tend to exhibit stronger long-term cash-flow durability.
Summary
The Intrinsic Value Calculator is designed as a systematic, rules-based valuation and quality assessment tool, integrating:
- Conservative intrinsic value estimation
- Yield comparison against risk-free benchmarks
- Financial strength and cash-flow sustainability analysis
By embedding these principles directly into the TradingView environment, the tool enables consistent, repeatable, and disciplined valuation analysis aligned with long-term capital preservation and risk-adjusted return objectives.
